"An approximate answer to the right problem is worth a good deal more than an exact answer to an approximate problem."
-John Tukey
pH recognition with RGB detector
This case was presented in kaggle´s forum, (For more information the link is in the reference section)
The CSV, that is available to download, is really simple, the are just 3 columns of input data and one output:

For the preliminary analysis the script prints the stats of the entire data set. After that, the script performed the plotting of the data. The plot shown is the following:

The image shows the raw information uploaded in kaggle. The red, green and blue column are the inputs of the system and the output is the pH of the solution, in this case the column name "label"

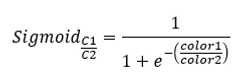
Nontheless, if a modification is done to the data set by performing what I call a sigmoidal modification that actually measure how big is one concentration of color against another, the formula looks like the following and is apply to the following relations:
Red/Blue
Red/Green
Blue/Green
If the sigmoidal value is added the prediction made by the for model improves approximately in a 10%. So is a process worth doing in this kind of case.
Parameters
After the data set cleaning and adding the sigmoidal modification the prediction models are applied. The conditions are the following for each model.
KNN Regression
Inputs: red, blue, green, R/B, R/G and B/G.
Output: label (pH)
k's to try: 20
Random Forest
Inputs: red, blue, green, R/B, R/G and B/G.
Output: label (pH)
Random State: 20
Linear Regression
Inputs: red, blue, green, R/B, R/G and B/G.
Output: label (pH)
Neural Network
Inputs: red, blue, green, R/B, R/G and B/G.
Neural structure:
Output: label (pH)
Epoch: 1500
Layers:
1: 24 neurons relu acivation
2: 24 neurons sigmoidal activation
3: 12 neurons sigmoidal activation
4: 3 neurons selu activation
5: 1 neuron (output)
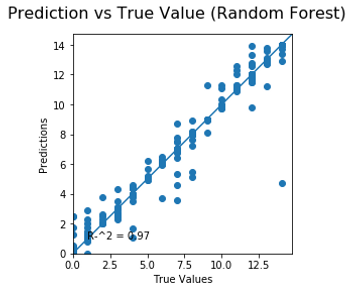
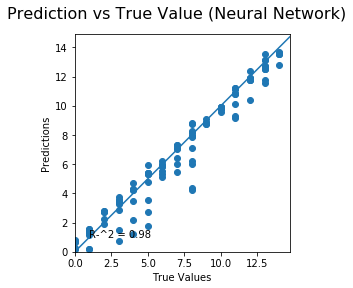
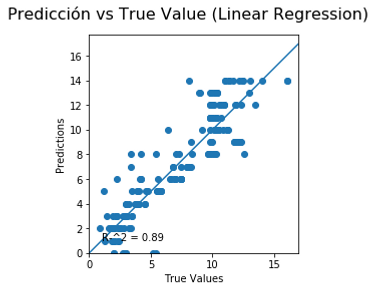
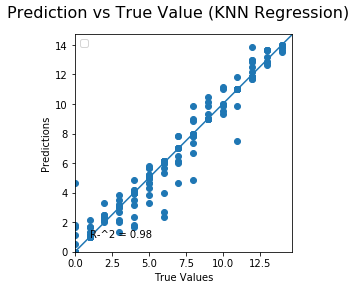
The result of the 3 predictions models are the following:

The figure shows several values for wach model:
LR: RMSE value, MAE value and R^2 of the prediction/test graph.
KNN: RMSE value, MAE value, best k for the model and R^2 of the prediction/test graph.
NN: RMSE value, MAE value and R^2 of the prediction/test graph.
RF: RMSE value, MAE value and R^2 of the prediction/test graph.
The error distribution is graph below and is used to analyze the error made by every single model, the purpose of this plot is to observe if the error made has some kind of tendency.
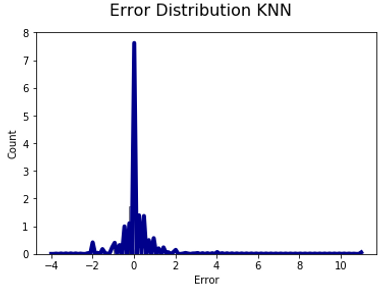
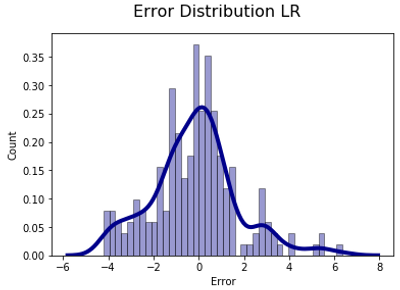
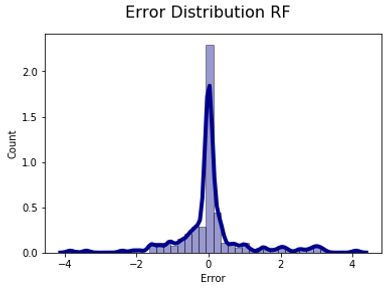
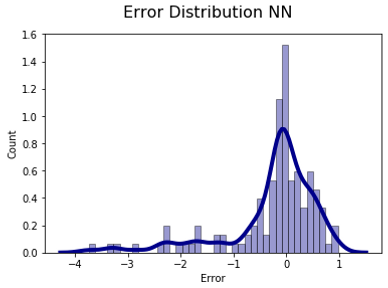
None of the distributions could be statistical consider as a normal distribution, Furthermore, there are a couple of detail in each graph, for the Neural Network graph, the tendency seems to have a tendcy predicting lower pH than it should be. For the linear regression, the error distribution has a big range of error, according to the results presented in the table before.
About the models....
KNN
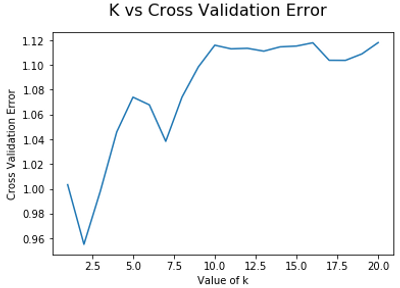
For this particular model 20 k´s were used for the reduction of the cross validation value, the graph is shown on the right. The minor value of the cross validation for this particular case : k=11
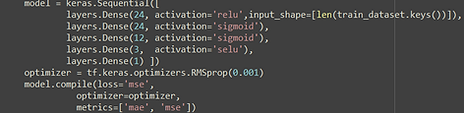
Neural Network
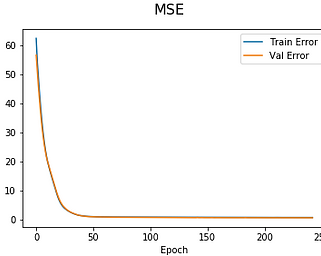
For the neural network the structure chose for the analysis is shown on the left. After that, th epoch for the model, for optimizing the fitting a patience model is added so the 1500 epoch are not run, the model stops at the epoch 250.
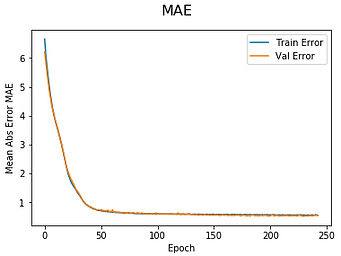
The learning rate for every epoch is this show in the following graphs:
Conclusion
The analysis made by this for models brings a lot of information of the behavior of the pH and its relation with the intensity of the RGB spectrum. The best two model for this analysis considering the R^2 and the distribution of the error are the Random Forest Algorithm and the K-Nearest Neighbors method. This models do not really need any sort of modification, but one of them could be modify: the Neural Network method. This method could be potentially modified in 3 ways: the method of optimization, the number of layers and neurons per layer and the activation method; this versatile model could potentially beat the other two, but several runs must be performed and different types of network.