"An approximate answer to the right problem is worth a good deal more than an exact answer to an approximate problem."
-John Tukey
Sigmoidal analysis and interpretation
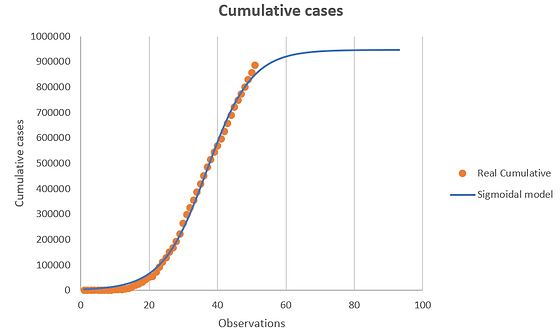
Talking about the acumulative curve shown before it is worth to try to fit this into a sigmoidal function, a simple one, shown below:
As it was done for the previous model, the goodnes of fit will be done by the maximum reduction of the RMSE.
The results from the fit are the following:


Interpretation
The μ value stands for the maximum value reach by the sigmoidal curve, in this case mean the maximum amount of confirmed cases in the n-observation.
In the case of τ, has a similar meaning as μ of the normal distribution analysis, so the value τ is the number of observation where the "daily cases" will be maximum.
Finally, the ϕ value stands for the rate of increase of the confirmed cases, a larger value of ϕwill mean a more abrupted increase of confirmed cases, and a lower value will mean an extend of the curve.
This model is just another approach to the accumulation of cases, as we all now this phenomena will become better proportionally to the amount of data we have, so it could be fitted several times if more data is available.